Introduction:
Body composition has been proposed to play an important role in clinical outcomes in patients with cancer, and low muscular mass has been associated with worse overall survival (OS) and disease-free survival (DFS) in different malignancies. Computed tomography (CT) assessment of body composition at the level of L3 vertebral body provides a reliable high-precision method for quantifying muscular mass, subcutaneous fat, and visceral fat with validated cutoff values. This method has been used in many hematological malignancies like acute myeloid leukemia and lymphoma, with promising results regarding correlation with disease outcomes, although it has not been explored in adult patients with acute lymphoblastic leukemia (ALL).
Methods:
This is a retrospective study from a tertiary care center in Mexico City that included adult patients with a new diagnosis of ALL according to the WHO criteria, who had a CT scan at the level of L3 done within 2 weeks of starting induction chemotherapy between 2014 and 2023. Using HorosTM software (version 3.3.6; Horos Project, United States), skeletal muscle, visceral fat, and subcutaneous fat areas (measured in cm 2) were quantified from an axial slice at the level of the L3 vertebral body using established Hounsfield unit (HU) thresholds for each specific tissue. These measurements were indexed for height and reported in cm2/m2. A low muscular mass was defined according to a 2011 consensus on cancer cachexia as a skeletal muscle index (SMI) < 55 cm 2/m 2 in men and < 39 cm 2/m 2 in women. Optimal cutoff points for subcutaneous adipose tissue index (SATI) and visceral adipose tissue index (VATI) to correlate with mortality were obtained with a receiver operating characteristic (ROC) curve.
Results:
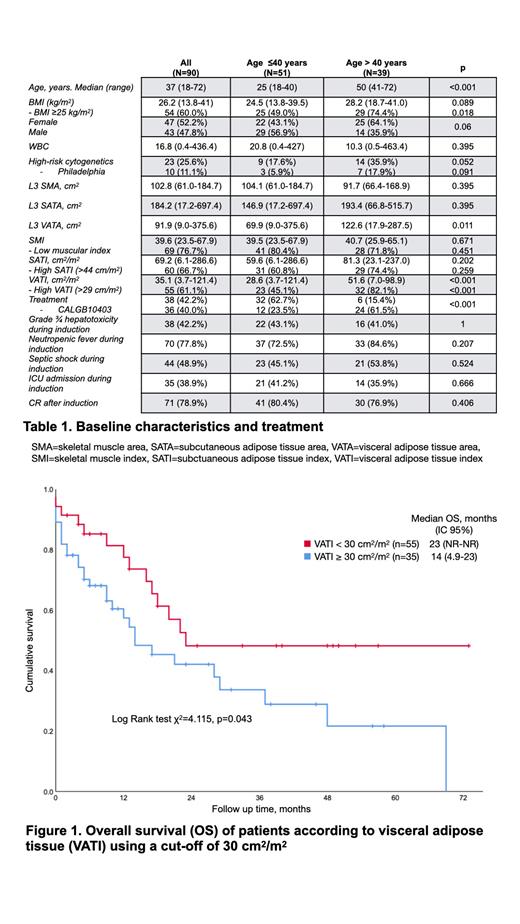
Ninety patients with a new diagnosis of ALL were included in the analysis. The median age at diagnosis was 37 years (range, 18-72), and 47.8% were male. Baseline characteristics and treatments are detailed in Table 1. The median SMI of the whole cohort was 39.64 cm 2/m 2 (range, 23.48-67.91). Sixty-nine patients (76.7%) fulfilled the criteria for low muscular mass. SMI was higher in male patients (43.9 cm 2/m 2 (27.1-65.1) vs. 35.1 cm 2/m 2 (23.5-67.9), p < 0.001). SATI was higher in patients with a body mass index (BMI) > 25 kg/m 2 (87.3 cm 2/m 2 (29.8-286.6) vs. 38.3 cm 2/m 2 (6.1-157.5), p < 0.001) and in female patients (84.2 cm 2/m 2 (6.1-286.6) vs. 44.2 cm 2/m 2 (8.1-157.5), p < 0.001). VATI was higher in patients > 40 years (49.2 cm 2/m 2 (7.0-98.9) vs. 27.4 cm 2/m 2 (3.7-121.4), p = 0.001) and with a BMI > 25 kg/m 2 (42.9 cm 2/m 2 (7.0-121.4) vs. 18.5 cm 2/m 2 (3.7-68.0), p = 0.001). The complete remission (CR) rate after induction was 78.9%. Minimal residual disease (MRD) after induction was assessed in 69 patients and was < 0.1% in 62.3% and < 0.01% in 24.6%. BMI > 25 kg/m 2 was associated with a higher risk of ICU admission during induction: OR 2.385 (95% CI 1.001-5.681). The median OS of the whole cohort was 20 months (95% CI, 13.28-26.71) with a 3-year OS of 39.8%. Age (> 40 years) and BMI > 25 kg/m 2 were not associated with worse OS. In the group of patients ≤ 40 years, OS was inferior with low SMI: median 20 months (95% CI, 12.0-28.0) vs. NR and a 3-year OS of 36.7% vs. 66.7%, p = 0.046. The optimal cutoff points to predict mortality for VATI and SATI were 30 cm 2/m 2 and 44 cm 2/m 2, respectively. OS was inferior in patients with a SATI > 44 cm 2/m 2: median 14 months (95% CI, 9.4-18.6) vs. NR and a 3-year OS of 33.6% vs. 51.5%, p = 0.042. When analyzing by sex, this was significant only for males with a 3-year OS of 62.6% vs. 18.2%, p = 0.01. OS was inferior in patients with a VATI ≥ 30 cm 2/m 2: median 14 vs. 23 months and a 3-year OS of 33.7% vs. 48.2%, p = 0.043 (Figure 1). This impact on OS was independent of BMI, with an HR of 2.05 (1.02-4.14), p = 0.045.
Conclusions:
A high percentage (76.7%) of adults with ALL fulfill the criteria for low muscular mass, and this is associated with worse OS in younger patients. SATI is significantly lower in males than in females, but using > 44 cm 2/m 2 as a cutoff in men, it is associated with a worse OS. VATI ≥ 30 cm 2/m 2 is associated with a worse OS regardless of BMI. CT represents an accessible approach for comprehensive body composition analysis, surpassing the capabilities of age and BMI. Its results bear substantial prognostic significance. Prospective studies that focus on interventions that may modify nutritional status could prove beneficial in adult patients with ALL.
Disclosures
Demichelis:Pfizer: Consultancy, Honoraria; TEVA: Consultancy, Honoraria; Astellas: Consultancy, Honoraria; AMGEN: Consultancy, Honoraria; Abbvie: Honoraria.


